AAG Clients
|


HEALTHCARE MEETS DATA & ANALYTICS
CLIENT: AUSTIN REGIONAL CLINIC (ARC)
HEDIS QUALITY MEASURES - 100% COMPLIANCE AND $1.5M+ YEARLY SAVINGS USING ANALYTICS & AUTOMATION
The Problems
|
Our SolutionEven though Breast Cancer Screening (BCS) is a completely different measure than Colorectal Cancer Screening (COL), NCQA describes each of the HEDIS measures in terms of its components viz. Measurement Dates, Eligibility criteria (age, gender, lookback period), diagnosis, numerator, denominator, and exclusions. Hence, a component-based measures architecture was created to define each measure with its nuances. Similarly, a data structure encompassing the data loads from NCQA was created which required minimal changes in the ETL process to load the measures and their value sets specified every year. Additionally, the relationships between SFs, Measures and sub-Measures, Health Plans, Payers, etc. were designed to be table driven.
|
Dalton Douglas, Clinical Informatics Manager, Austin Regional Clinic (ARC)
Benefits
» $1.5M+ shared savings per year!
» Improved compliance from 43% to 100%
» High degree of automation
» 70% complete from the get-go for new SF! Minimal ETL changes
» Better predictability
» Better negotiating leverage
» Measures-driven, components-based architecture
» Tables-driven, scalable architecture
» Risk-based QA
» Works for both Commercial and Medicare Advantage Health Plans
» Strong SF data & analytics architecture foundation for future
Client Speak
Results exceeded our expectations – not only did AAG solve for our existing needs they equipped us with the tools to adapt for the future. As a result, we gained substantial efficiency and ability to know our performance level at any given point in time!
- Lucy Sumner, VP Population Health and Clinical Quality
Ajay has previous experience with ARC in which he helped build the data warehouse that is in use right now. He also worked on a short turn-around time project in which we had to report to a medical society a report that has significant financial implication. In addition to those, he has done extensive training not only within the Austin market but with the University of Texas as well. We took all of those into consideration when we were looking for a consultant in moving us forward with supplemental files project.
- Dalton Douglas, Clinical Informatics Manager
CLIENT: AUSTIN REGIONAL CLINIC (ARC)
EMBARKING ON ANALYTICS JOURNEY BY HARNESSING GOOD QUALITY DATA IN A DATA WAREHOUSE

|
Benefits» Self-service reporting
» Well defined governance & organization structure » Better predictability » Increased productivity & alignment » Better negotiating leverage » Analytics team trained on Data Warehouse fundamentals, Dimensional Modeling, SQL, Normalization, Tableau » Strong data harnessing foundation for future |
Client Speak
Thank you for helping our team learn, reorganize, and improve.
- VP Population Health and Clinical Quality
Was able to understand conceptually and helped put things in perspective. Very helpful.
- Chief Medical Information Officer
Appreciated the preparation and sequencing of topics Ajay went through. Also, it was nice to see it distilled to us 'non-techies.'
- Financial Analyst
Examples used in class were excellent choices. Wasn't way over my head! Very good class.
- Business Analyst
CLIENT: AUSTIN REGIONAL CLINIC (ARC)
INSTRUMENTING CAMPAIGNS FOR MARKETING ANALYTICS
The NeedIn early 2019, ARC's marketing team needed help with their campaign promoting healthiness among their central Texas community, and as a result, purchased an automated email marketing tool. Although they were excited about the tool, it was difficult for them to figure out where to start. There were a lot of things that they could do with this tool, but didn't know how to organize the channels of communication in it. Moreover, they wanted to communicate to existing patients (versus new patients) for any of their new products whether it was a new clinic, a new program, or a new specialty. In order to better understand the journey of prospects/existing patients to healthiness program patients, they decided to engage with AAG.
|
Strategy & ImplementationAAG had already worked with ARC’s Population Health Department for many years. AAG had not only helped ARC develop a data warehouse but also helped teach their team about the data, the processes for loading and transforming the data, as well as the organization of data i.e. the data architecture of the data warehouse.
AAG deployed a similar strategy in helping the Marketing department. In working with the team and the new email marketing tool, we realized the importance of understanding the states of patients as they came into ARC. The first step in this process was to pull together and develop a state diagram that depicted the different states in which a person goes through from the first time they hear about the program, to signing up for the program, and beyond. With the help of process state diagrams and marketing metrics and definitions, AAG showed how to effectively use the marketing tool for customer acquisition in this and all future campaigns. In addition, identifying disparate data sources, differentiating between existing patients and prospects in the acquisition funnel were some of the key enablers in instrumenting for future Analytics. Training the team members in this approach and having requirements discussions leading up to the 4 possible healthiness outcomes became a central piece of a “data-driven” mindset. |
Heidi Shalev, VP of Marketing, Communications, & Engagement, Austin Regional Clinic (ARC)
Benefits & Value
The ARC Marketing team is now equipped with marketing metrics and the process to instrument any campaign. This is what they were able to implement successfully not only for the Healthiness campaign but have adopted for all their campaigns in the future. AAG helped the team to think about marketing in a much more strategic way, anchored in Analytics. Finally, the ARC executive team has benefited by receiving the most relevant and important KPI’s explaining the real value of marketing campaigns.
Client Speak
After we rolled out the campaign, based on what we worked on with AAG, I will say we had great success.
What I see though as even greater success, is that it didn’t just help us with one campaign. So now every campaign that we roll out using this new tool, we go through the same process, so that we get the same excellent results!
- Heidi Shalev, VP Marketing, Communications, & Engagement
INSURANCE SAVINGS WITH DATA & ANALYTICS
CLIENT: HEALTH & LIFE INSURANCE ADVISORS
DIRECT MARKETING SAVINGS OF 50x IN 5 YEARS!
INSURANCE MARKETING EFFICIENCY & ACCURACY WITH AUTOMATION

The Problems
|
Our Solution» ETL processes resulting in turn around time of Load process in few hours versus greater than 3 days!
» More than 95% of Leads automatically loaded as STP in seconds resulted in estimated cost savings of 50x over 5 years! » Complete management transparency in Load process » Automated Lead Name and Address identification and matching » Strong Data Architecture and Analytics foundation for future Benefits» Faster Customer Acquisition – Quick STP processing with no breaks or restarts due to distractions or other priorities!
» Well defined Governance & Organization Structure - Analytics Architecture, Processes, Scripts, and well-defined roles have enabled right governance structure for success » Better predictability – Better Planning for future feeds and appends resulting from increased transparency into Load process » Maintaining History – Improved Association interaction communicating data changes over time » Accurate Mailings – Less disgruntled members by reducing human errors in name identification with exact and fuzzy matching » Reduced Loss of Sales to Competition – Monthly mailing to Prospects enabled, Elimination of backlogs of feeds, enhanced documentation, reduced learning curve » Strong Foundation for future – Additional Associations and feeds could be automated lot faster now due to automation |
Client Speak
As CDO-on-Demand, Ajay not only did a quick current state analysis of our data and analytics, but put together a plan for the management team on executing our data strategy to improve our business.
Whether it is finding a way to improve customer acquisition strategy, vendor selection, training team members, or making a huge impact in the data consumption of marketing conversion of leads to customers, Ajay and his team at AAG have been an exceptional partner in contributing to our success and providing real business value.
- CEO
I didn’t think we could automate the name standardization process to the extent we did, before starting the project! I am a believer.
- Data Specialist Supervisor
These interns have accomplished quite a bit considering how little they knew about everything before starting. They have a very flexible and positive attitude.
- Programmer
ANALYTICS for procuring SMART Cities Initiatives
CLIENT: TATA TELECOM
EXECUTIVE WORKSHOP:
1. HOW CAN ANALYTICS BE LEVERAGED BY EXECUTIVES?
2. HOW CAN ANALYTICS HELP IN PROCURING SMART CITY INITIATIVES IN INDIA?
The Needs
» How can Executives leverage the usage of Analytics pervasively in each line of business?
» Can we use the power of Analytics & Open Data Sets to showcase how a Go-To-Market (GTM) strategy could be conducted in a “Smart, Data-Driven” way with minimal of investments?
» Can we use the power of Analytics & Open Data Sets to showcase how a Go-To-Market (GTM) strategy could be conducted in a “Smart, Data-Driven” way with minimal of investments?
Our Approach
|
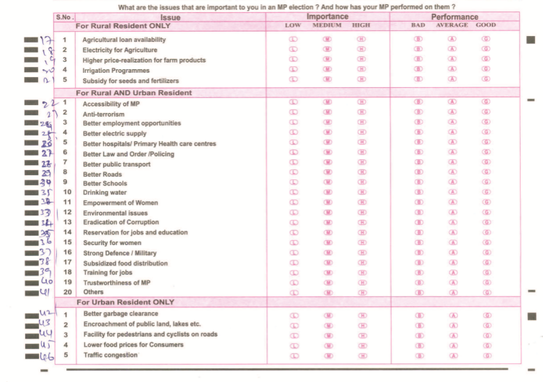
DATA
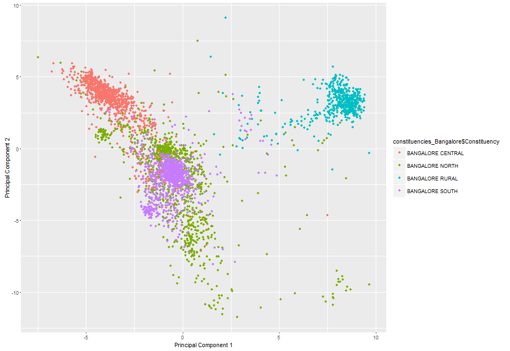
» Found a voter survey dataset (approx. 236,000*200 records) for voters rating their MP (Member of Parliament) in India for each of the 437 districts measured » voter's survey data consisted of demographics, preferences, and for each of the 30 issues, their Importance (I) & Performance (P) » For Data Preparation, removal of irrelevant data, Standardizing I and P, duplicate removal, convert categorical responses to numerical columns were some of the steps resorted to prior to using algorithms ALGORITHMS For the city of Bengaluru in Karnataka, used the following techniques for Analysis 1. Principal Component Analysis (PCA) 2. Clustering 3. Descriptive Analytics |
Results & Recommendations
|
PCA
» Focus heavily on issues in PC1 for Rural » Focus heavily on issues in PC2 for Central » Take a look at both PC1 and PC2 for North and South Issues in PC1: Better Hospitals/Primary Healthcare Centers, Subsidized Food Distribution, Traffic Congestion, Better Roads, Better Public Transport, Lower Food Prices For Consumers, Better Garbage Clearance, Security For Women, Drinking Water, Empowerment of Women and Facility For Pedestrians And Cyclists On Roads Issues in PC2: Agricultural Loan Availability, Irrigation Programmes, Better Schools, Better Employment Opportunities, Environmental Issues, Training For Jobs, Better Law And Order/Policing, Better Electric Supply and Strong Defense Military |
|
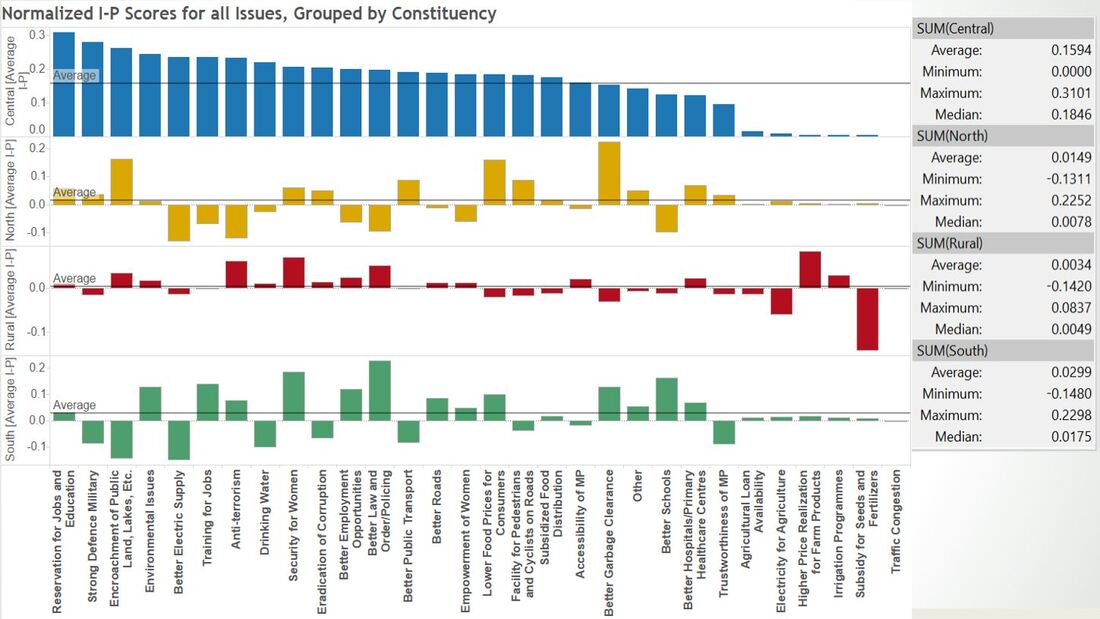
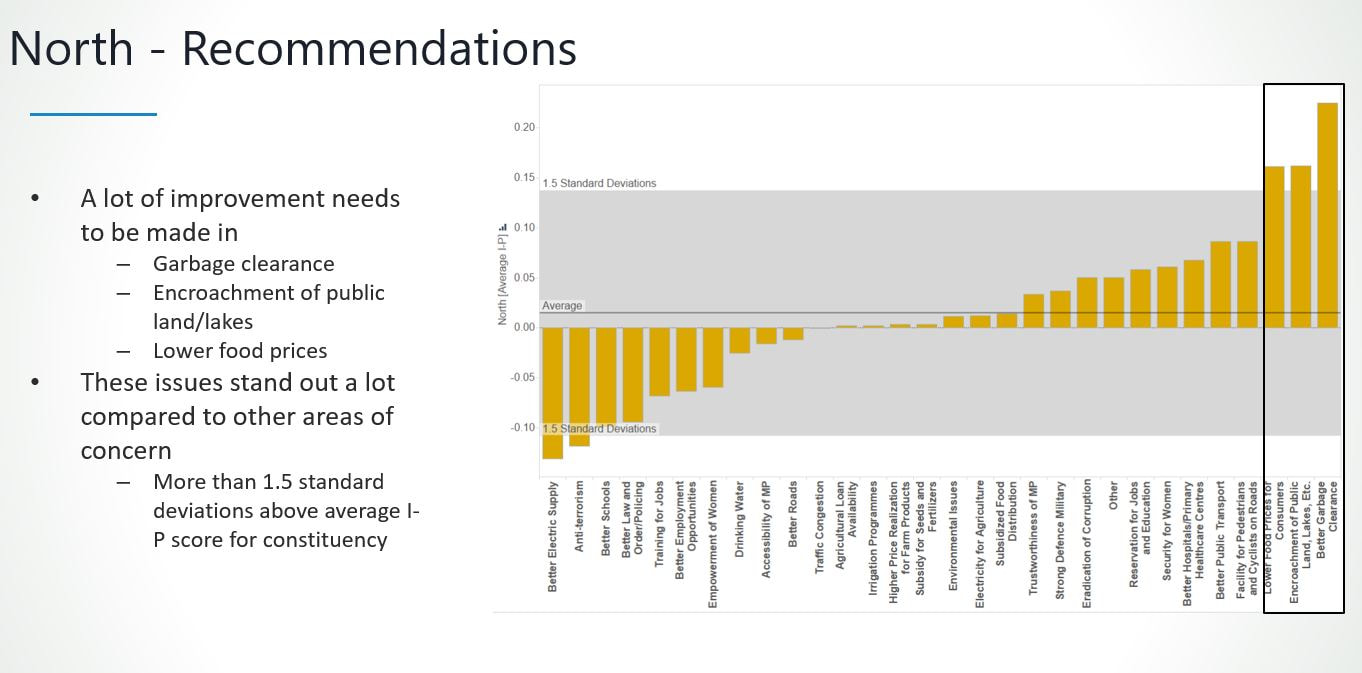
DESCRIPTIVE ANALYTICS
» Plot 1: Normalized I-P Scores for all issues, grouped by constituency » Plot 2: Normalized I-P Scores for all issues, for NORTH Bengaluru » Recommendations given for each of the 4 regions of Bengaluru » Also, based on clustering analysis, it would be beneficial to split the country sales folks from a cluster basis, rather than geography basis to increase the odds of true understanding of priorities for smart city initiatives |
MANUFACTURING ASSESSES DATA & ANALYTICS
CLIENT: LARGE CHIP MANUFACTURER
HOW DO WE LAY A BETTER DATA & ANALYTICS FOUNDATION FOR IMPROVED FORECASTING?

The Needs
|
Our ApproachThe client’s users, projects, data and analytics needs had grown tremendously and especially so in the last couple of years. In order to meet the needs of future growth, they engaged with us to explore how their data and analytics environment could scale up to better forecasting the current and future needs.
AAG conducted Phase 0 of Data & Analytics Assessment for client’s current & future needs. Apart from presenting the findings and recommendations, AAG delivered a roadmap with a proposal for a phased implementation of future state. Assessment Workshop BenefitsThe Assessment resulted in the following Benefits for Client:
» Comprehensive Current State Assessment & Phased Future State Proposal » Current State Observations, spanning - Data & Analytics - Processes & People - Tools & Technologies » Recommendations for Future State - Technology & Data Harnessing - Harvesting Value & Algorithms - Phased Tracks Approach » High Level Data Flow Architecture » High Level Requirements (BI Reports) » Roles, Investments, Roadmap » Strategy to address gaps » Governance model |
IT MANAGEMENT - "DATA SCIENCE DRIVEN"
CLIENT: SPICEWORKS
HOW DO WE BECOME LOT MORE "PROACTIVE" AND "DATA SCIENCE" DRIVEN? - ASSESSMENT WORKSHOP
The Needs
|
Our SolutionSpiceworks embarked on a journey to spearhead data science to be more of a driving product than a reactive product through building an organizational structure and robust platform to harness and harvest data.
Analytics Advisory Group was able to recommend a robust and sustainable model to Spiceworks in order to continue addressing the needs of business users, clarify entities within the Spiceworks system, and increase value creation to keep Spiceworks in the forefront of the technological sphere. Assessment Workshop BenefitsAfter conducting a Data & Analytics Assessment across different teams in Spiceworks, we were able to recommend the following:
» Focus on Data Governance A separation of “core” vs. “non-core” activities, identification of roles (especially in Architecture) following the C.A.M.P. model, and a separation of “what” and “how” is needed. » Employee Analytics Training An emphasis on Tableau, advanced analytics, and text analytics (NLP exploitation) enforces a strong analytical background for future data science initiatives. » Enforcement on Business Identity and History Maintenance » Need to “Data Instrument” for “Personas” » Switching to More Robust Software Applications and Storage Switching on premise to the Cloud, delving into Python, Kafka, and SQL, cementing a data management platform would prevent old hardware failure and update systems to be more sustainable for increasing data needs. |
Past Clients - Experiences & Capabilities
Partial List of Analytics Clients served in the past
INSURANCE
North America:
Hartford, London Life (GWL), Chubb, Liberty Mutual, State Farm, CNA, USAA, AIG, Farmers Insurance, GenRe, SwissRe, TransAmerica
Europe:
Aviva, Allianz, AXA (UK), AEGON
RETAIL
H.E.B., Delhaize Group (Food Lion, Delhaize, Hannaford Brothers), Roundy’s, Whole Foods
JC Penny, Limited Brands
Walgreens, Rite Aid, Eli Lilly
TxDOT, ToysRUs, Best Buy, Lowes
HEALTHCARE
Kaiser, Aetna, CHS
BANKING AND FINANCIAL SERVICES
American Express, Morgan Stanley, Bank of America, JP Morgan Chase
TELECOM
AT&T, Verizon
P&C INSURANCE MEETS BIG DATA & ADVANCED ANALYTICS
CLIENT: AXA (UK)
HOW DO WE CHOOSE A BIG DATA PLATFORM?
The NeedsThe current state analysis detailed that AXA UK needed to find a platform to make underwriting and pricing to run efficiently and find a SAS environment that can handle large volumes of data for BAU or discovery analytics.
Data processing times of up to seven to nine hours and a lack of technological readiness to deal with growing business growth was a dire need. Hence, wanted to increase speed of analytics and scale data to future growth volumes. Additionally, lot of manual processes needed to be automated. |
Our Solution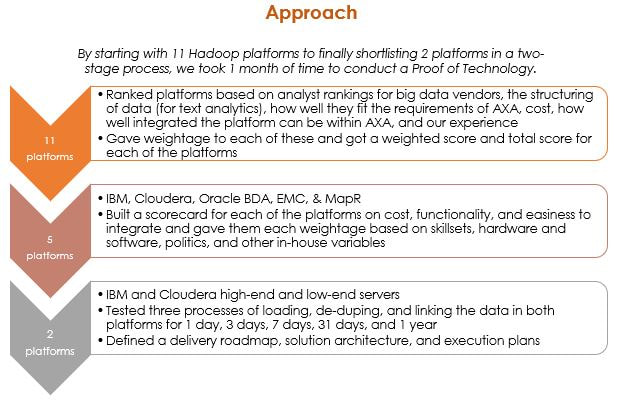
Benefits» Increased Speed of Analytics from 7-9 hours to less than 3 minutes
» Handle Scale of Current and Envisaged Volume of Data by scaling 1 day’s worth of data to 1 year » Reduced Cost of Data Preparation by Increasing Automation » By picking servers through weighted evaluations, AXA UK was able to minimize costs in choosing a suitable platform for efficient harnessing of Data |
CLIENT: AXA (UK)
Leveraging Unstructured Data to identify Risk Factors

The NeedsThe current state analysis detailed that AXA UK’s risk pricing team used structured internal and external data to identify new rating factors for use in risk pricing models but lacked the use of unstructured data and text analytics from claims to detect rating factors.
AXA UK wanted to » Process unstructured data from claim records and attachments » Identify potential claims with indications of suspicion using a fraud dictionary » Identify potential new rating factors for underwriting » Understand the iterative, discovery process of looking at unstructured data |
Our Solution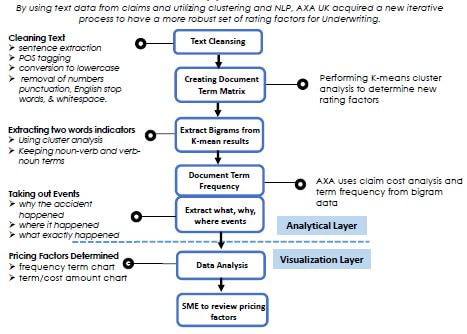
Benefits» Significant proven value in unstructured data
» Successful segmentation by what, why and where » Number of threads exposed that should be of interest for pricing and/or underwriting action » Potential operational issues exposed in data » Emerging trends can be spotted using these techniques » Data quality issues impact and irrelevant data impacts analysis speed, requires careful handling » Use of Claims SME critical to manage challenges. It will be possible for ML to enhance SME role, through creation of specific dictionaries. This will also allow the iterative learning to be kept in house over time » Automated the identification of new rating factors and processing claims » By using R and big data configuration that could be used in handling large volumes of data, parallel processing made industrializing easier and rating |
CLIENT: AXA (UK)
Leveraging Unstructured Data to identify Fraud in Claims and improve Straight-Through-Processing (STP)

The NeedsAlthough all claims involved high amount of unstructured data, it was not being used to identify suspicious cases nor improve straight through processing (STP) time. Due to the sheer
volume of claims and limited SIU staff, a binary, rules based approach was used to flag fraudulent claims resulting in many claims going undetected for suspicious activity. AXA UK wanted to » Process unstructured data from claim records and attachments for fraud detection » Identify potential claims with indications of suspicion using a fraud dictionary » Speed up STP for non suspicious claims » Understand the iterative, discovery process of looking at unstructured data 
|
Our Solution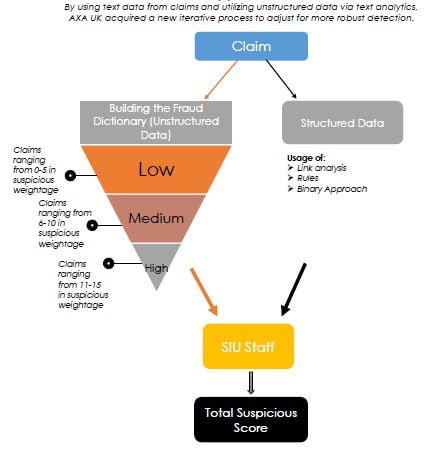
Benefits» Reduced Fraud
Reducing the volume of fraudulent activity allowed AXA UK to keep costs low and premiums high » Improved STP Using unstructured data, speed of non suspicious claims for STP was drastically improved, thus improving customer service » Reduced the time taken to process suspicious claims from 7-9 hours to less than 3 minutes Decreased the time required to process claims and harvest data by using automation » Created new methodologies from unstructured data for fraud detection By altering the approach of detecting fraud, AXA UK were able to use text analytics, a new ontology, and automated processing to harvest data for suspicion » Improved Subrogation Increasing Subrogation recoveries allowed for AXA UK to retain a significant portion of money during pay out thus reducing costs |